We value your privacy

    We use cookies to enhance your browsing experience and analyze our traffic. By clicking "Accept", you consent to our use of cookies. Learn more
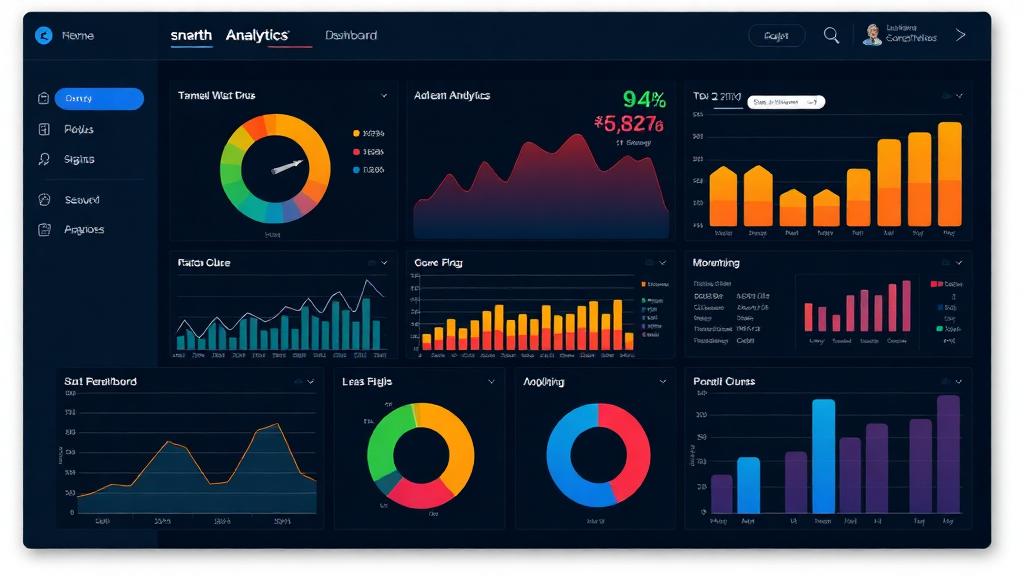

    Understanding Website Analytics: Key Metrics That Matter
    Marketing

    Understanding Website Analytics: Key Metrics That Matter

    Filtedev

    Filtedev

    WE CARE

    8 min read

    Making sense of your data to drive better business decisions.

    Making Sense of Your Website Data

    Analytics data is only valuable when it leads to action. Raw numbers overwhelm; insights drive improvement. Understanding which metrics matter and how to interpret them transforms data from noise into direction.

    Essential Metrics

    Traffic Metrics

    Understanding audience:

    • Sessions: Total visits
    • Users: Unique visitors
    • Pageviews: Total pages viewed
    • Pages per session: Engagement depth
    • Session duration: Time spent

    Acquisition Metrics

    Where traffic comes from:

    • Organic search: From search engines
    • Direct: Typed URL or bookmarks
    • Referral: Links from other sites
    • Social: Social media platforms
    • Paid: Advertising traffic
    • Email: Campaign clicks

    Behavior Metrics

    How users interact:

    • Bounce rate: Single-page sessions
    • Exit rate: Leaving from specific pages
    • Site search: What users look for
    • Events: Specific interactions

    Conversion Metrics

    Business outcomes:

    • Conversion rate: Goal completions / sessions
    • Goal completions: Target actions
    • Revenue: E-commerce value
    • Assisted conversions: Multi-touch attribution

    Setting Up Analytics Properly

    Goal Configuration

    Define success:

    • Form submissions
    • Purchases
    • Sign-ups
    • Downloads
    • Key page views

    Event Tracking

    Measure interactions:

    • Button clicks
    • Video plays
    • Scroll depth
    • File downloads
    • Outbound links

    Enhanced Tracking

    Deeper insights:

    • E-commerce tracking
    • User ID tracking
    • Site search tracking
    • Campaign parameters

    Interpretation Skills

    Context Matters

    Numbers need context:

    • Compare to previous periods
    • Account for seasonality
    • Consider external factors
    • Segment for clarity

    Vanity vs. Actionable Metrics

    Focus on what drives decisions:

    • Pageviews alone mean little
    • Conversion rate informs optimization
    • Time on page needs context
    • Revenue per visitor guides investment

    Common Analysis Questions

    Traffic Quality

    Not all traffic is equal:

    • Which sources convert best?
    • What's the bounce rate by source?
    • Which channels drive value?
    • Where should budget go?

    Content Performance

    What works:

    • Which pages attract traffic?
    • Which drive conversions?
    • Where do users drop off?
    • What keeps them engaged?

    User Journey

    How people navigate:

    • Entry points
    • Path through site
    • Conversion paths
    • Drop-off points

    Segmentation Power

    Standard Segments

    Built-in views:

    • New vs. returning visitors
    • Mobile vs. desktop
    • Geography
    • Traffic source

    Custom Segments

    Business-specific views:

    • Converters vs. non-converters
    • High-value users
    • Engaged visitors
    • Campaign responders

    Creating Reports

    Dashboard Design

    At-a-glance insights:

    • Key metrics prominently
    • Trend visualizations
    • Goal progress
    • Comparison to benchmarks

    Regular Reporting

    Consistent monitoring:

    • Weekly traffic summary
    • Monthly deep dives
    • Quarterly reviews
    • Annual benchmarking

    Common Mistakes

    Obsessing Over Traffic

    Quality matters more than quantity.

    Ignoring Mobile

    Separate analysis often needed.

    Missing Conversion Tracking

    Traffic without outcomes is meaningless.

    Over-Reporting

    Too many metrics obscure insights.

    Not Acting on Data

    Analysis without action is wasteful.

    Tools Beyond Basic Analytics

    Heatmaps

    Visual behavior:

    • Click patterns
    • Scroll depth
    • Attention areas
    • Confusion points

    Session Recordings

    Watch real users:

    • Navigation patterns
    • Struggle points
    • Confusion indicators
    • Success paths

    User Surveys

    Qualitative insights:

    • Why visitors came
    • Whether they found what they needed
    • What would improve experience
    • Net promoter scores

    Privacy Considerations

    Data Collection

    Responsible analytics:

    • Cookie consent
    • Privacy policy clarity
    • Data minimization
    • Retention limits

    Cookieless Future

    Adapting to changes:

    • First-party data focus
    • Aggregated reporting
    • Privacy-preserving methods
    • Consent management

    Taking Action

    Regular Review Cadence

    Consistent attention:

    • Daily: Check for anomalies
    • Weekly: Review trends
    • Monthly: Deep analysis
    • Quarterly: Strategic review

    Action Planning

    From insight to improvement:

    • Identify opportunities
    • Prioritize by impact
    • Plan experiments
    • Measure results

    Analytics is not about collecting data—it's about gaining understanding that drives better decisions. Start with what matters most to your business, measure it properly, and act on what you learn.

    Share this article:

    Ready to Start Your Project?

    Let's discuss how we can help bring your vision to life.